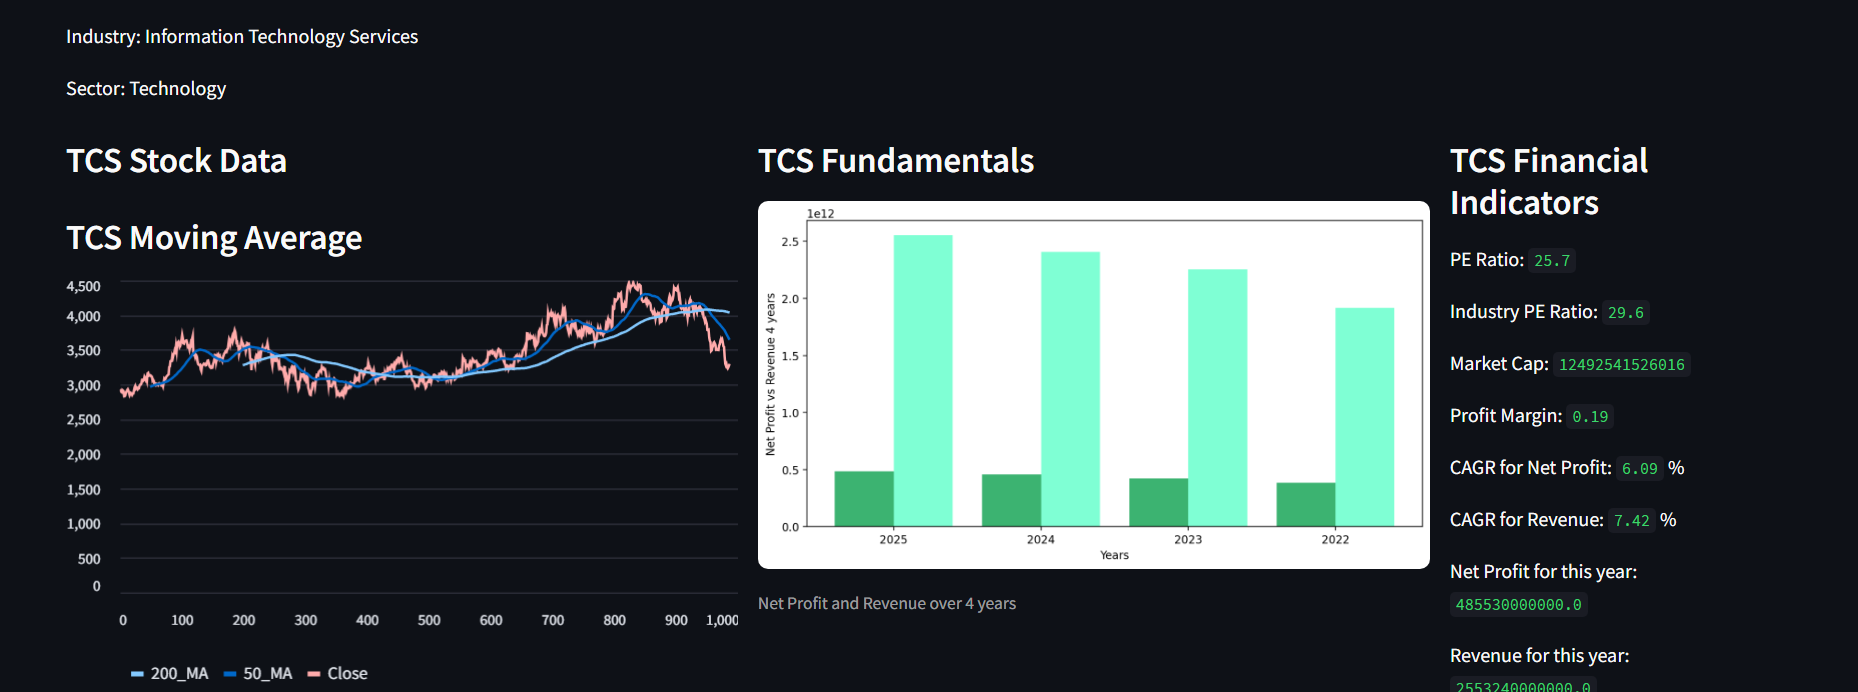
TCS Stock Dashboard
Using Python
An interactive dashboard built with Python and Streamlit to analyze TCS stock trends. It uses yfinance to fetch historical stock data and pandas/plotly for analysis and visualization. Key features include candlestick charts, moving averages, and volume insights. This project highlights my skills in data handling, visualization, and dashboard development.